library(tidyverse)
work.dir ="~/Downloads/hapmap/"
functions
tileplot <- function(mat)
{
  mat = data.frame(mat)
  mat$Var1 = factor(rownames(mat), levels=rownames(mat)) ## preserve rowname order
  melted_mat <- gather(mat,key=Var2,value=value,-Var1)
  melted_mat$Var2 = factor(melted_mat$Var2, levels=colnames(mat)) ## preserve colname order
  rango = range(melted_mat$value)
  pp <- ggplot(melted_mat,aes(x=Var1,y=Var2,fill=value)) + geom_tile() ##+scale_fill_gradientn(colours = c("#C00000", "#FF0000", "#FF8080", "#FFC0C0", "#FFFFFF", "#C0C0FF", "#8080FF", "#0000FF", "#0000C0"), limit = c(-1,1))
  pp
}
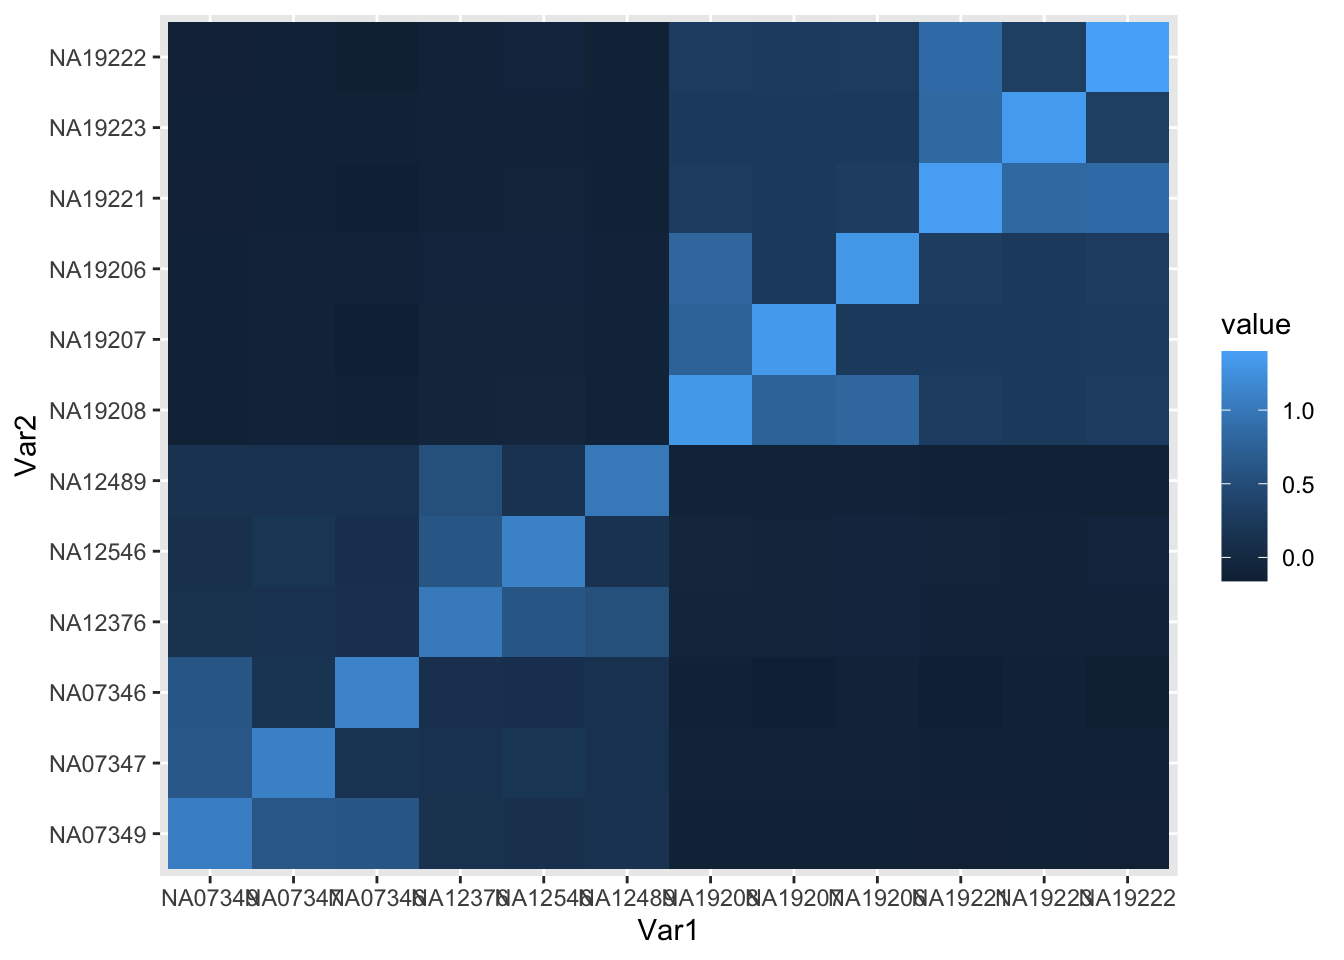
plot GRM to show population structure
## calculate GRM using plink, use grm.gz format
grmhead = paste0(work.dir,"output/hapmapch22")
cl_calc_grm = glue::glue("plink --bfile hapmap_ch22 --make-grm-gz --out {grmhead}")
print(cl_calc_grm) ## run this in the command line
## plink --bfile hapmap_ch22 --make-grm-gz --out ~/Downloads/hapmap/output/hapmapch22
## define function to read GRM (in grm-gz format) into matrix
grmgz2mat = function(grmhead)
{
  ## given plink like header, it reads thd grm file and returns matrix of grm
  grm = read.table(paste0(grmhead,".grm.gz"),header=F)
  grmid = read.table(paste0(grmhead,".grm.id"),header=F)
  grmat = matrix(0,max(grm$V1),max(grm$V2))
  rownames(grmat) = grmid$V2
  colnames(grmat) = grmid$V2
  ## fill lower matrix of GRM
  grmat[upper.tri(grmat,diag=TRUE)]= grm$V4
  ## make upper = lower, need to subtract diag
  grmat + t(grmat) - diag(diag(grmat))
}
## select a 2 CEU and 2 YRI individuals
## 1345    NA07349 NA07347 NA07346 1       0       CEU
## 1353    NA12376 NA12546 NA12489 2       0       CEU
## Y004    NA18500 NA18501 NA18502 1       0       YRI missing NA18502
## Y051    NA19208 NA19207 NA19206 1       0       YRI
## Y058    NA19221 NA19223 NA19222 2       0       YRI
ind = c("NA07349","NA07347","NA07346","NA12376","NA12546","NA12489",
        "NA19208","NA19207","NA19206",   "NA19221","NA19223","NA19222")
## read grm calculated in plink into R matrix
grmat = grmgz2mat(grmhead)
## plot grmat to see the population structure
tileplot(grmat[ind,ind])

